

Add TOPKHOJ as a Preferred Source on Google
Bitcoin has entered a pivotal consolidation range, trading tightly between $79,600 and $79,800 after an intraday push toward $82,000 met sharp overhead selling pressure. As the apex cryptocurrency tests the psychological $80,000 threshold, derivatives positioning and order book liquidity indicate that the market is coiling for an imminent directional expansion.
While technical analysts point to firm multi-month baselines along long-term moving averages, market watchers remain divided on whether the next major leg will claim $85,000 or deliver a liquidity sweep toward $75,000.
30-Second TL;DR
- Spot Range: Bitcoin trades between $79,600 and $79,800 after facing rejection at the $82,000 liquidity wall.
- The Breakout Trigger: Analyst Crypto Rover highlights a confirmed daily close above $83,000 as the technical confirmation required to signal a full bull market resumption.
- The Pullback Risk: Market analyst Ted Pillows questions whether Bitcoin hits $85,000 or sweeps down to $75,000 first, noting that a retest of $77,000-$75,000 could reset overheated funding rates.
- Structural Support: Analysts including Ash Crypto and KillaXBT emphasize that macro bottoms remain intact, with the 200-day and 300-day moving averages acting as multi-month demand floors.
The Battle for $80,000: Heavy Resistance at $82,000-$83,000
The rejected rally toward $82,000 highlighted a dense cluster of ask orders on major spot and derivatives exchanges. While bulls absorbed aggressive short positions during the climb from the mid-$70,000s, profit-taking and hedging around previous local highs stalled upward momentum.
- The $83,000 Threshold: Popular analyst Crypto Rover noted that the current chop below $80,000 is characteristic of late-stage accumulation before a macro breakout. However, he emphasized that clear confirmation requires breaking through the $83,000 resistance zone, which would invalidate local bearish divergence and signal the return of a dominant upward trend.
- Order Book Friction: Exchange heatmaps indicate substantial liquidity pools clustered directly between $81,500 and $83,000, creating an overhead barrier that requires sustained spot volume to penetrate.
Analyst Divergence: $85,000 Expansion vs. $75,000 Reset
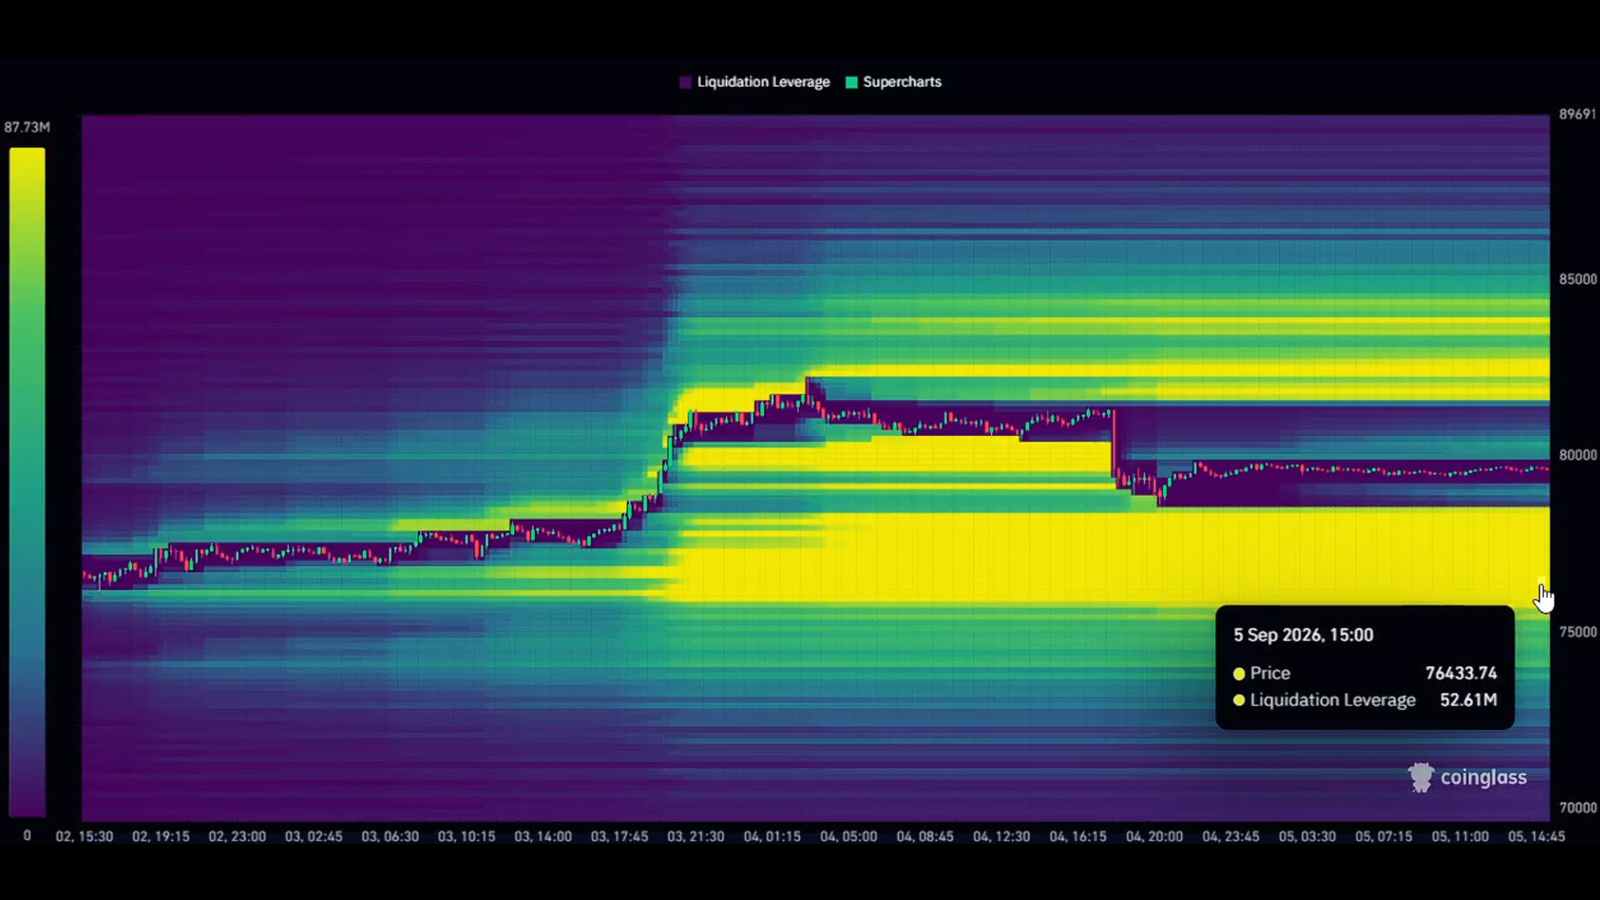
Trading sentiment is split between an immediate continuation to new local highs and a corrective pullback designed to flush leveraged longs:
- Ted Pillows’ Dilemma: Widely followed analyst Ted Pillows framed the current market juncture by asking whether BTC reaches $85,000 or $75,000 first. While structural indicators tilt bullish, an interim drop toward $75,000 would mirror previous cycle patterns where late long entries were liquidated before major breakouts.
- The Bottoming Thesis: Conversely, traders such as Ash Crypto and KillaXBT argue that Bitcoin’s broader bottoming structure is already complete. They point out that extended sideways consolidation above major support levels has historically served as a base for vertical expansions rather than precursors to deep structural crashes.
Bitcoin Technical Landscape: Bull vs. Bear Scenarios
| Market Scenario | Key Price Targets | Technical Catalysts / Triggers | Probability / Sentiment |
| Bullish Breakout | $83,000 → $85,000+ | Daily close above $83,000; spot ETF inflows; short squeeze | High momentum on volume confirmation |
| Sideways Range | $78,500 – $81,500 | Choppy consolidation; weekend liquidity dry-up; low volatility | Neutral baseline / accumulation phase |
| Corrective Pullback | $77,000 → $75,000 | Rejection at $80,000; funding rate reset; long liquidation cascade | Healthy mid-term reset before leg higher |
Moving Averages: The 200-Day and 300-Day Support Floors
A primary argument supporting the bullish structure is Bitcoin’s positioning relative to its long-term moving averages:
- Dynamic Support: The 200-day and 300-day moving averages have served as critical multi-month floors. Throughout recent volatility, BTC has consistently posted higher swing lows above these indicators.
- Momentum Oscillator Reset: The Relative Strength Index (RSI) across the 4-hour and daily timeframes has eased from overbought conditions without breaking market structure, allowing price action to digest recent gains.
Should bears trigger a pullback, technical analysts view the $77,000 to $75,000 range as an optimal high-timeframe retest zone where institutional limit bids are heavily concentrated.
Market Outlook
With Bitcoin trading within touching distance of $80,000, the coming weekly candle close will likely define market direction for the remainder of September. A sustained push above $83,000 would open the door toward the psychological $85,000 milestone and blue-sky territory, whereas failure to hold the $78,500 local swing low could trigger a temporary retracement to test buyer demand at $75,000.
🚨 Stay Updated with TopKhoj! 🚨
Get the latest tech news, deals, and exclusive offers first!
📰 Visit News Section📲 Join our Telegram Channel for real-time updates and best deals!
🔗 Join Telegram Now💡 Stay informed and never miss a great deal with TopKhoj!
⚠️ Disclaimer: Any link provided in the article related to a product or service will redirect you to our affiliate partner(s)' website, which are affiliate links. This means that if you make a purchase through these links, we may earn a commission at no extra cost to you. This commission helps support our blog and our work.
🔔 All prices mentioned above are subject to change based on current offers and availability on e-commerce platforms. Please check the latest price and product details on the product page before making a purchase.